New Cardinality Counters in Trisul 4.0
Trisul 4.0 is just around the corner. We are starting a series of posts explaining some of the really powerful features in this release.
Lets take a look at Cardinality Counting an extremely powerful metric that you can put to real world use today.
What is cardinality counting ?
Cardinality counting is a count of the number of distinct elements in a given dataset. For an online system like Trisul Network Analytics, the dataset is a never ending continuous stream of network traffic. The general statistic we seek is : How many unique X did each Y see ?
A canonical example of a cardinality based query. Show me how many unique hosts were seen by my HTTPS server on port 443.

The problem might appear to be simple because the tools are already available. We could just keep track of the unique elements in an in-memory hashtable and just return the size of the hashtable. This will indeed work but imagine if you had to do this for a 100 million unique items over an indefinite stream. Your hashtable now contains 100M keys and will cause you to use more memory and CPU as the table gets bigger.
Enter HyperLogLog
It turns out that this is such a fascinating problem that it has spawned off extensive research looking for algorithms that try to make it somewhat tractable. One such algorithm is called HyperLogLog originally based on a 2007 paper by Phillipe Flajolet The algorithm is explained in splendid detail on the Aggregate Knowledge Tech Blog Using only a small amount of memory it is possible to estimate to a great degree of accuracy the uniqueness of a given dataset. It is one of these algorithms that make you go – “There is no way… wait. It works. More coffee please.”
Cardinality Estimation in Trisul
!./ images/card-2.png!
Trisul allows you to meter cardinality at a counter group level. Each counter group can have up to two cardinality counters. Trisul will spin up an instance of Hyperloglog for each key within the counter group. Lets say you enabled a cardinality counter for the Apps counter group for counting unique Hosts. Every application will now use a separate instance of HyperLogLog to count unique hosts it has seen.
Trisul Cardinality Sketch features
- Max 2 cardinality counters per counter group
- All keys in a group automatically start counting
- Shipped with 3 counters – Unique Hosts per App, Unique Apps per Host, and Unique Hosts per Host (peering)
- You can add your own counters; Unique Hosts per Country is a useful one.
- Cardinality is estimated for each time bucket (30s). This allows you to track cardinality over time. See the section below for why we do this and not a simple cardinality value per day.
- CPU needs for each counter are very modest but Trisul uses an extra 32 bytes for each key.
Streaming cardinality sketch
Trisul deals with a continuous torrent of data. There is no begin and no end. Therefore instead of a single number, a single cardinality estimate, Trisul stores sketches of cardinality for every time bucket (default 30s). This allows you to build a very powerful trend of cardinality over time. The main application of such a sketch is to detect storms, DDoS, and other anomalous activity. Here is an example.
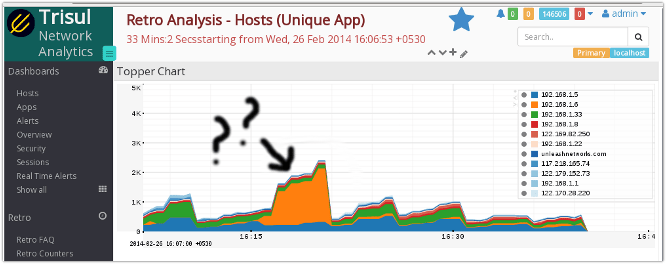
Here is a retro analysis of a fully utilized 30Mbps line. We are showing hosts by bandwidth. There appears to be nothing noteworthy about it. Correct?

Now here is the same time interval on the same traffic, but this time we show the streaming sketch of unique ports (apps) for each host

The chart couldnt be any different, its like looking at a completely different network. The storm involving 192.168.1.6 which created a burst of connections to unique ports stands out. While this, by itself, does not indicate a DDoS, Worm, or other phenomena, it gives you priceless clues. Tells you which direction to go hunting.
Using: Once configured, cardinality counters appear and behave like any other counter. You can view toppers, trend them, draw long term charts, set Threshold Crossing Alerts, etc.

Free Download Trisul 4.0
If your team is actively “hunting” in live and past network traffic for behavioural trends and anomalies, you really need to have access to this level of statistical information. Trisul Network Analytics 4.0 is now available – sign up and download. Enjoy!