Security monitoring systems generate a steady stream of alerts. A suspicious connection here, a scanning attempt there, maybe an unusual authentication event.
Each alert might be worth investigating, but on its own it often looks like an isolated signal. Analysts still have to answer the bigger question: is this just noise, or part of an attack?
This is where the MITRE ATT&CK framework becomes useful. It organizes attacker tactics and techniques observed in real-world intrusions and gives security teams a common language to describe adversary behavior.
During a recent discussion, one of our customers asked a simple question:
Can network detections from Trisul be mapped to the MITRE ATT&CK framework so analysts can immediately understand what kind of attacker behavior an alert might represent?
That question led to a feature we recently developed in Trisul, which will be available in the upcoming Trisul 8.0 release.
Instead of treating alerts as standalone technical events, detections can now be mapped directly to ATT&CK tactics and techniques, giving analysts immediate behavioral context for activity observed in network traffic.
Why Network Detections Matter for ATT&CK
Many ATT&CK detection examples focus on endpoint telemetry or log analysis. However, a large number of attacker techniques also produce recognizable network behavior.
Examples include:
| Network Signal | ATT&CK Technique/ Sub-technique |
| Port scanning patterns | T1046 – Network Service Discovery |
| Periodic outbound connections | T1071 – Application Layer C2 |
| High-entropy DNS queries | T1071.004 – DNS Tunneling |
| Internal SMB bursts | T1021 – Remote Services |
| Large outbound transfers | T1041 – Exfiltration Over C2 Channel |
Because these behaviors appear in network traffic, network monitoring provides another vantage point for identifying ATT&CK techniques.
Implementing ATT&CK Mapping in Trisul
To support this use case, we implemented a capability in Trisul that maps network detections directly to MITRE ATT&CK tactics and techniques.
The goal was not simply to attach ATT&CK labels to alerts, but to integrate ATT&CK context into the detection pipeline and the investigation interface.
This required work across multiple components of the system:
- detection rules
- ATT&CK classification logic
- internal ATT&CK data structures
user interface visualization
Detection Pipeline with ATT&CK Context
At a high level, the detection pipeline connects network traffic with ATT&CK classification.
- Network Traffic
- Suricata Detection Engine
- Alert Generation
- ATT&CK Mapping Layer
- Alert with ATT&CK Context
- ATT&CK Matrix Visualization
This pipeline ensures that when suspicious activity is detected, the alert already contains information about the ATT&CK technique it may correspond to.
Suricata Detection with ATT&CK Metadata
Network traffic is first analyzed by the Suricata detection engine, which inspects packets and flows using rule-based detection.
For this feature, the relevant Suricata rules include MITRE ATT&CK metadata. When these rules trigger, the alert generated by Suricata can include:
- ATT&CK tactic
- ATT&CK technique ID
- ATT&CK sub-technique ID (when applicable)
- rule classification details
Because the ATT&CK metadata is embedded directly in the detection rule, alerts already contain contextual information about the adversarial behavior they may represent.
When applicable, alerts may reference both the technique and the specific sub-technique, allowing detections to be mapped more precisely within the ATT&CK framework.
Structuring the ATT&CK Framework Internally
A key part of the implementation involved organizing the MITRE ATT&CK framework into a structure that the platform could reference during detection and analysis.
Within Trisul, the ATT&CK knowledge base has been represented as an internal reference model consisting of:
- 14 tactics
- hundreds of techniques
This structure allows alerts to be matched against ATT&CK techniques and organized according to the ATT&CK matrix.
Much of the groundwork for this effort was carried out by Ajaya, who researched and structured the ATT&CK framework into a form the system could reference during detection. Building on that foundation, Partha worked on integrating the mapping logic and ensuring the ATT&CK context was properly reflected in the Trisul interface.
As straightforward as the idea sounds, translating a framework as large as ATT&CK into something a detection engine can actually use takes a fair bit of engineering effort (and, reportedly, a steady supply of tea during long debugging sessions).
Instead of treating detections as isolated events, alerts can now be interpreted within the broader attacker lifecycle.
ATT&CK Mapping Layer
Once alerts are generated, they pass through a mapping layer inside the platform.
This layer processes the ATT&CK metadata contained in detection rules and associates the alert with the corresponding tactic and technique.
At this stage, the alert is enriched with ATT&CK information so analysts can immediately see:
- the attacker objective (tactic)
- the attack method (technique)
- the position within the ATT&CK matrix
This enrichment happens automatically as part of the detection pipeline.
Visualizing ATT&CK Activity in the Trisul Interface
Another important part of the feature is how ATT&CK information is presented to analysts.
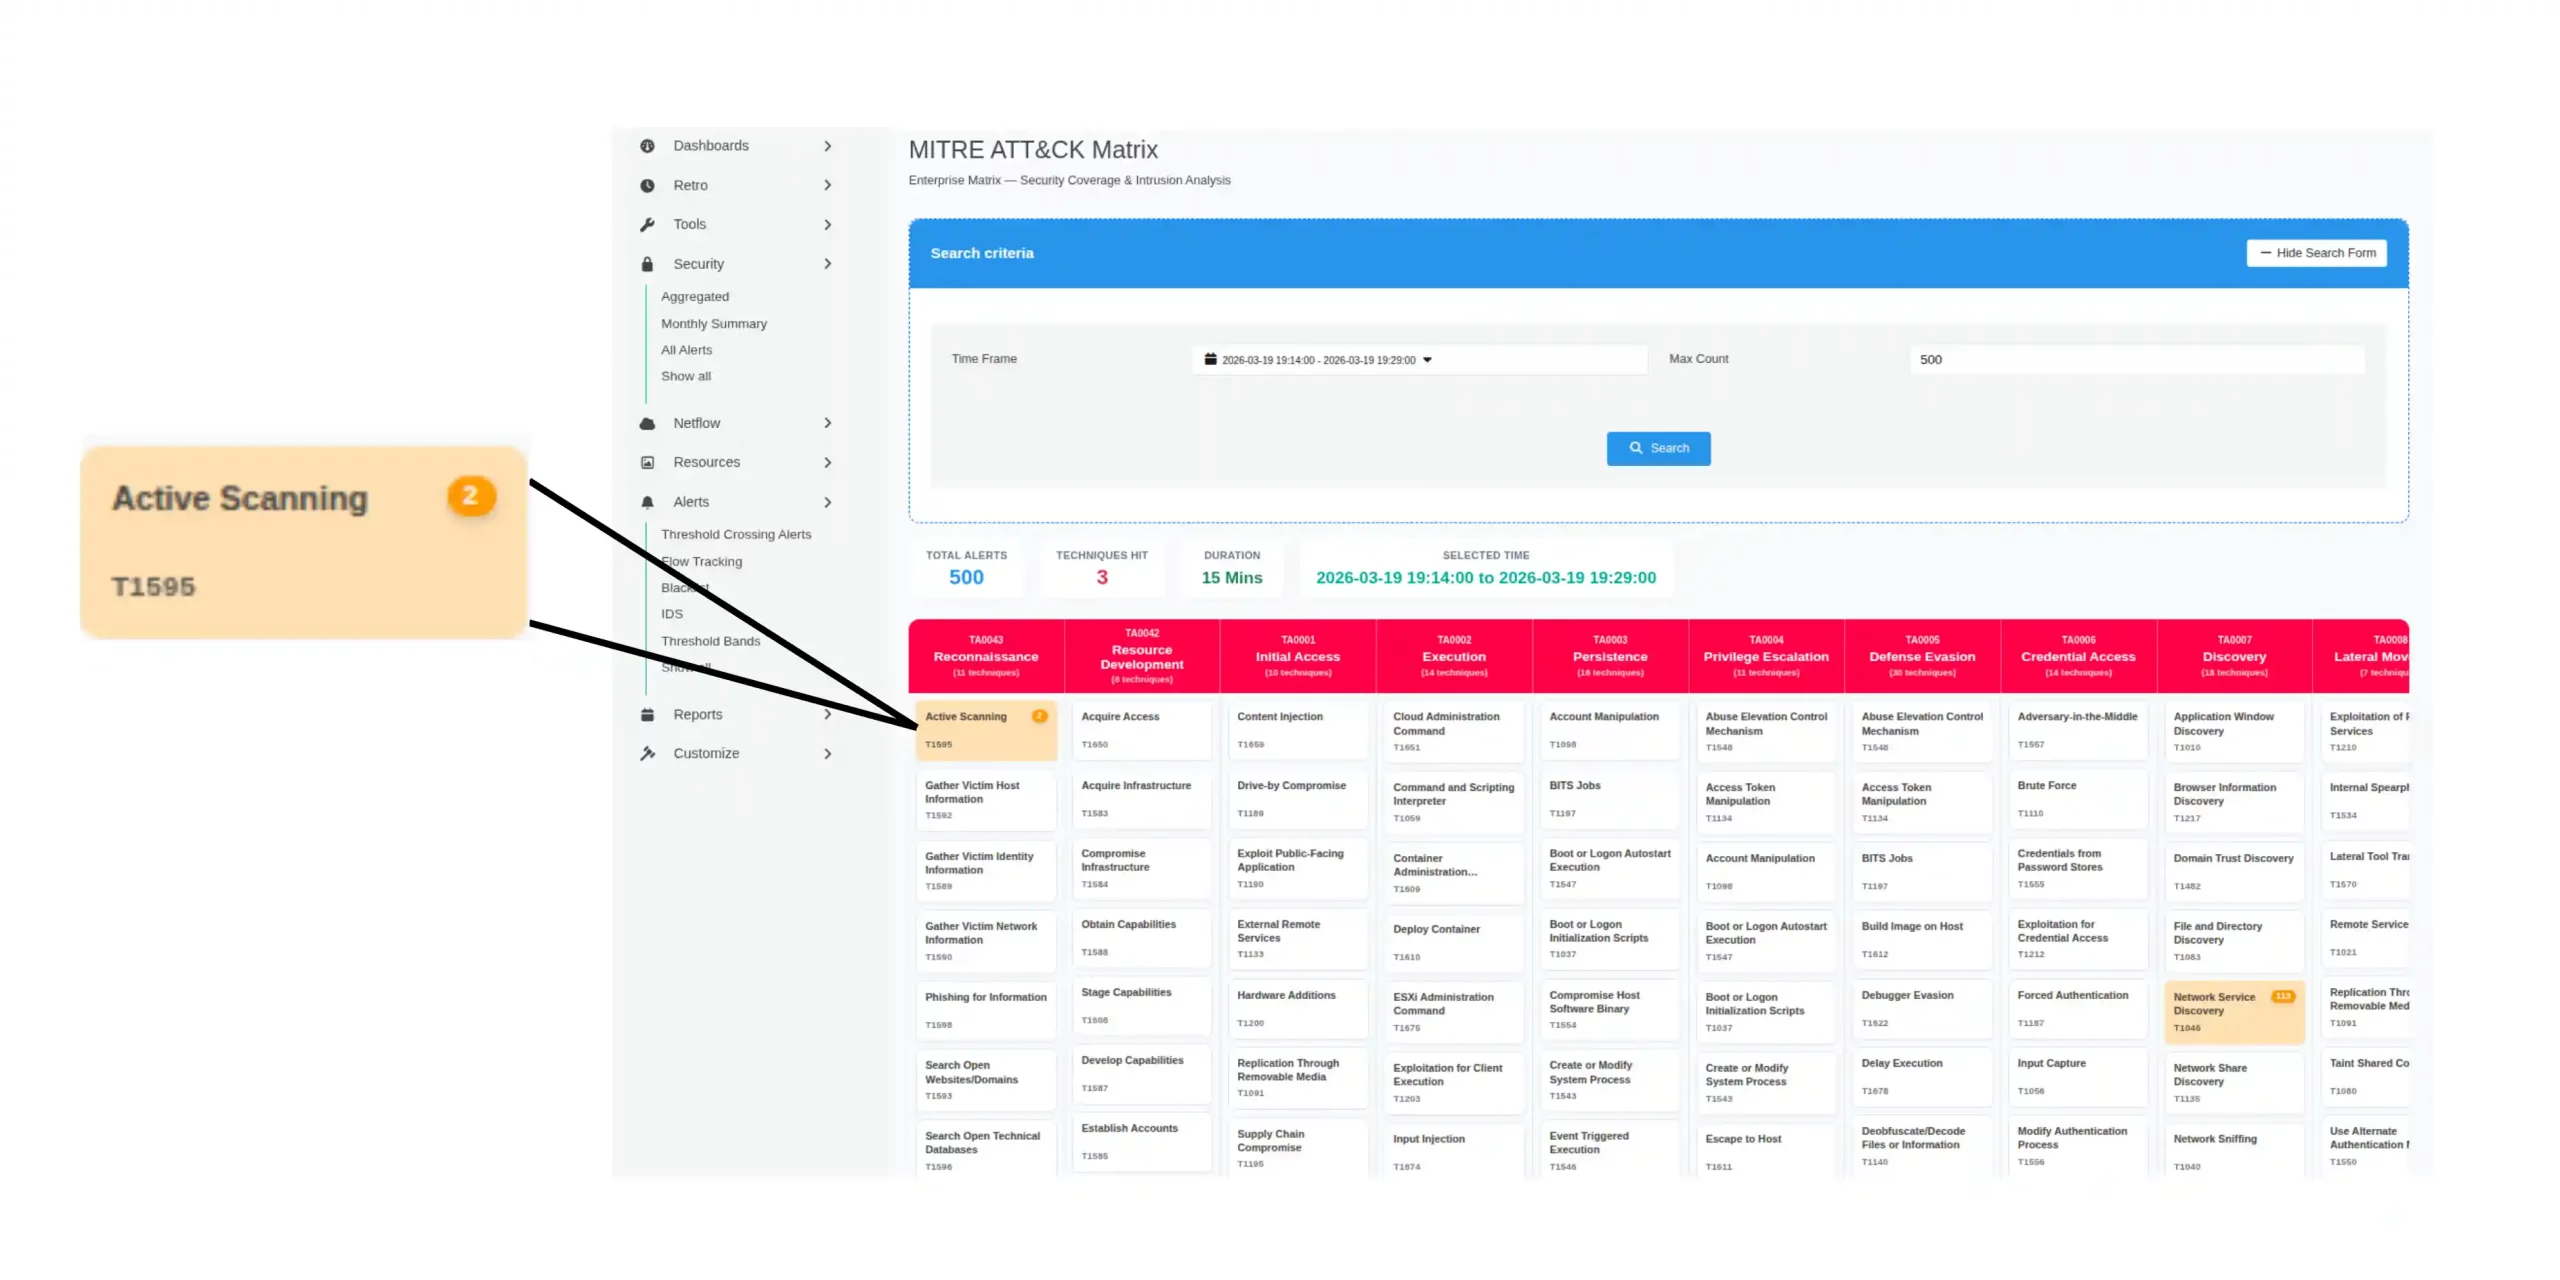
Instead of simply displaying technique IDs in alerts, the MITRE ATT&CK matrix is integrated directly into the Trisul interface.
When detections associated with specific techniques occur, the corresponding techniques in the matrix are highlighted. The interface also displays the number of alerts mapped to each technique, allowing analysts to quickly identify which attacker behaviors are occurring most frequently in the observed activity.
For example, activity mapped to T1595 – Active Scanning will highlight that technique within the matrix view.
This allows analysts to quickly understand:
- which attacker techniques have been observed
- which stages of the attack lifecycle are active
- whether multiple alerts may represent a coordinated attack sequence
By viewing detections within the matrix itself, analysts can move from individual alerts toward a behavioral understanding of attacker activity.
Also the technique and sub-technique IDs displayed in alerts are interactive. Selecting a technique opens the corresponding MITRE ATT&CK reference page, allowing analysts to review detailed descriptions of the technique along with recommended mitigation strategies and defensive measures.
Figure 2 – MITRE ATT&CK matrix embedded in the Trisul interface with detected techniques highlighted
Using ATT&CK Mapping for Detection Coverage
Mapping detections to ATT&CK techniques also helps security teams evaluate detection coverage.
By tagging alerts with ATT&CK IDs, analysts can identify:
- which attacker behaviors are visible through network telemetry
- which tactics are frequently detected
- where potential detection gaps may exist
This makes ATT&CK mapping useful not only for investigations, but also for improving detection strategies.
Where This Work Is Heading
Bringing the ATT&CK matrix directly into the Trisul interface also provides a unique investigative perspective. Analysts can move from individual alerts to a behavioral view of attacker activity, helping them understand how different detections may relate to each other across the attack lifecycle.
We’re currently putting the finishing touches on this capability, refining how detections are mapped and how ATT&CK context is presented to analysts during investigations.
The goal isn’t simply to generate more alerts. It’s to help security teams recognize when individual network events may actually be pieces of a larger attack sequence.
Looking ahead, we are also exploring ways to correlate detections across techniques and suggest possible attacker paths based on observed rules and behavioral patterns. By analyzing how different detections relate to ATT&CK tactics and techniques, the system can help analysts visualize how an intrusion may be unfolding across the network.
Sometimes the difference between spotting an attack early and discovering it too late is simply having the right context.
And that’s the kind of problem we’ve been working on solving lately.