Sneak Peek: What’s Coming in the Upcoming Trisul Release?
Behind the scenes, we’ve been crafting a feature that will transform how you visualize multicast traffic, quite literally.
In our latest Trisul release, we’re introducing a feature that directly addresses one of the most persistent blind spots in network visibility. And it comes from listening closely to the challenges our customers especially in finance and other security-sensitive sectors face daily.
The Struggle Is Real: Understanding Multicast Traffic
Multicast traffic is a core part of many financial networks. From market data feeds to internal distribution systems, it’s widely used for efficient one-to-many delivery.
But here’s the problem: visualizing and analyzing multicast traffic has always been difficult.
We observed that our customers consistently faced challenges like:
- Not being able to see which IPs are sending to or receiving from multicast groups
- Lack of correlation between ICMP joins/leaves and actual data traffic
- No clear picture of how much traffic was flowing within each multicast group
- Tools offering either too little detail, or forcing manual correlation across multiple sources
Multicast traffic often existed as a black box and when something went wrong, the troubleshooting process was tedious and incomplete.
That’s Why We Built: Multicast GraphX
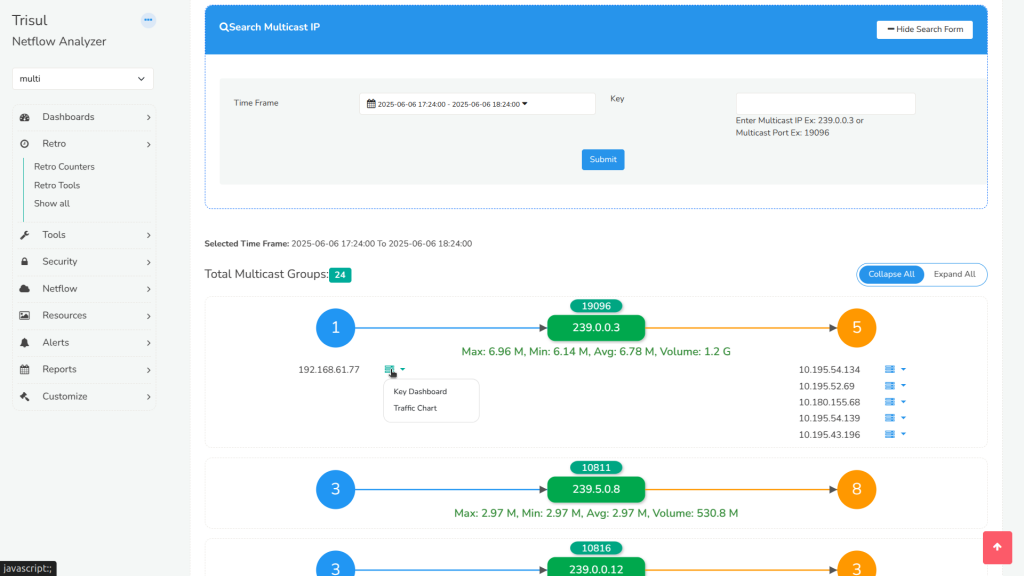
Multicast GraphX is our new interactive visualization tool designed specifically to bring clarity to multicast traffic analysis.
Multicast GraphX works alongside the ICMP Multicast App, which is required to be installed and active. You can install from Trisul Apps collection on GitHub. This app provides the necessary ICMP protocol context such as multicast group activity that Multicast GraphX uses to display meaningful traffic relationships.
How Does It Work?
Imagine each multicast group as a central hub in a traffic map:
- The center node is the multicast group (IP and Port)
- The left side shows how many senders are transmitting to the group
- The right side shows how many receivers are listening

Click on any node to:
- View the list of sender or receiver IPs
- See traffic charts over time
- Jump to the corresponding Trisul Key Dashboards
- Check live stats like bitrate, volume, and flow dynamics
It’s a visual, click-through experience powered by D3.js designed to turn complex multicast patterns into something you can explore and act on with confidence.
Prerequisite: ICMP Multicast App
Multicast GraphX works alongside the ICMP Multicast App, which must be installed and active. This ensures you’re getting both protocol-level visibility (ICMP joins/leaves) and actual traffic flow metrics, a combination that most tools fail to provide.
Who Is This For?
If you’re in an environment with heavy multicast usage especially in securities, trading infrastructure, or financial services, this feature is built for you.
Why It Matters
Multicast GraphX solves a real operational gap:
- It visualizes multicast group structure and relationships
- Correlates protocol activity with actual traffic metrics
- Makes it easy to troubleshoot and explore group-level behavior
- Removes the need to stitch together raw logs and flow exports manually
It brings multicast traffic out of the shadows and onto your screen in a way that makes sense.
Coming Soon
Multicast GraphX will be available in the upcoming Trisul Network Analytics release. If multicast is a critical part of your infrastructure this will change the way you explore and understand your network traffic.
