One frequently comes across the concept of “Flows” in Network Traffic Analytics. A flow is nothing but a connection between two endpoints between which packets and bytes flows. This quick blog post explains the top three flow metrics in Trisul.
Top three flow metrics
- Netflow flow record rate – how many Netflow flows are processed
- Active flows – how many flows are active in the entire system or per host or per application
- Flushed – how many flows are flushed to the database
As indicated by the name the first two are only available in Netflow mode. The last two in both Netflow and Packet mode.
Lets consider each one in detail.
Netflow record rate
To view this use the following metric – you can use Tools > Long Term Charts to view this, or use Netflow > Netflow Sources
- Counter Group : FlowGens
- Meter : Flow Records
- Key : Router IP or SYS:GROUP_TOTALS for total
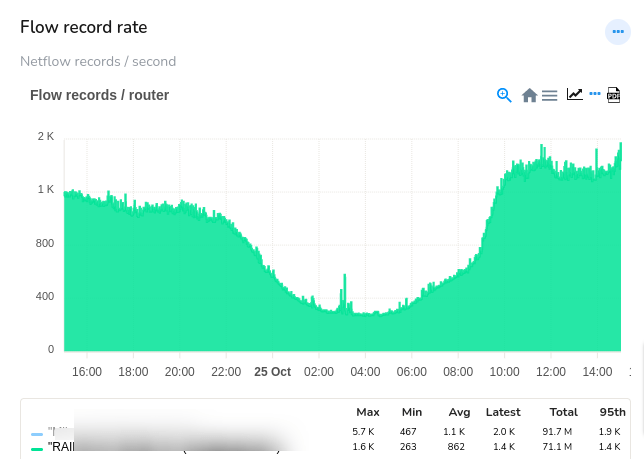
In Netflow mode, network elements continuously send Netflow packets to Trisul Network Analytics. These packets contain flow information such as source ip, source port, dest ip, dest port, bytes, packets etc. A single Netflow packet can contain around 25-30 flow. The Flow Records metric measures the flows / second processed by Trisul per Router.
The following chart should be interpreted as “the green router is sending 1000 to 1500 flows/second. The max/min/avg/total are shown in the table below. The Total means for the 24 hour time period selected the Trisul system received 91.7 Million flows from the green router.

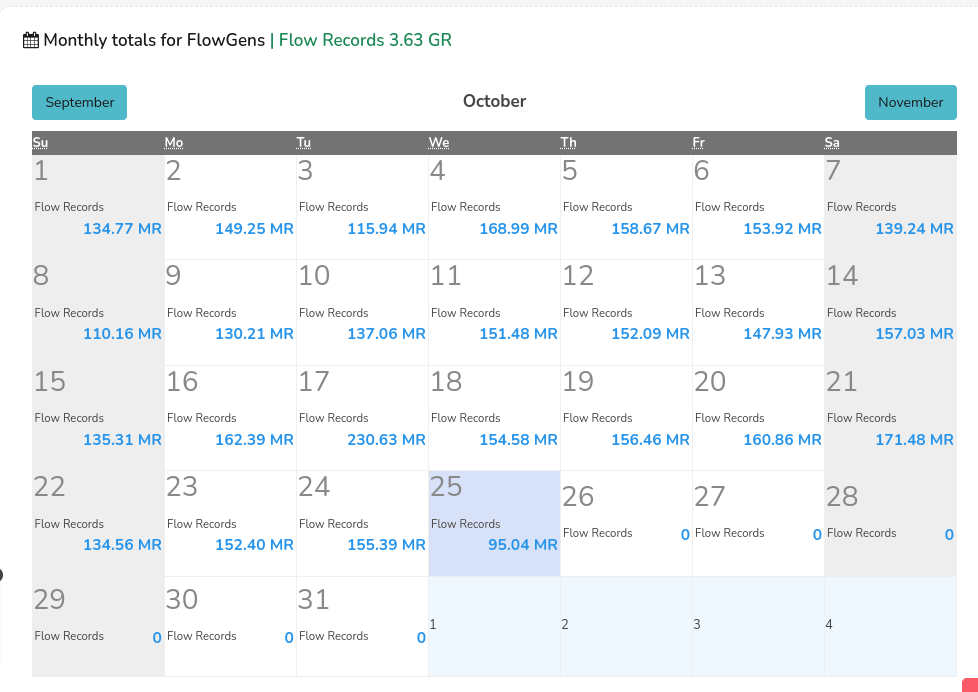
You can also view the daily flow counts by using Tools > Monthly chart, then select the Counter Group/ Meter/ Key as mentioned above to get daily counts of flows processed. Here the unit is “R” which stands for Records (flow records).

Active flows
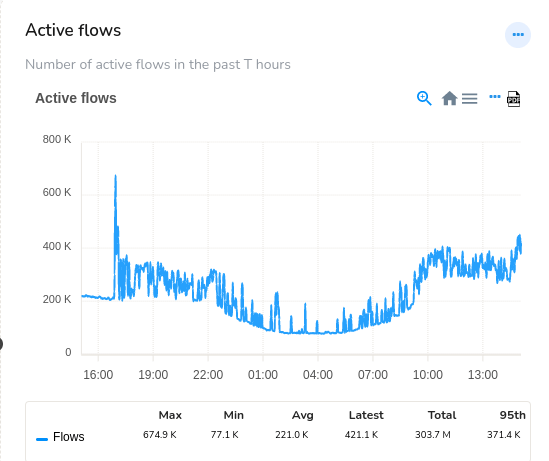
As flows are processed in Trisul Network Analytics, they are kept in memory called the active cache and the running counters updated as records or packets are received. Once the flow terminates – such as by a TCP 4-way FIN or RST protocol they are removed from the active cache and flushed. A flow can also be moved out of the active cache if there is no activity for a 2-minute period. The Active flows metric measures the number of flows in the active cache. This metric is useful to measure and track flow activity independent of bandwidth. Flow based DDoS , SYN flooding or other attacks can be seen by this metric.
To view this : go to Current Hosts > Active flows or use the following in Tools > Long Term Charts
- Counter Group : Meta Session Group
- Meter : Master Size
- Key : Sessions
The following chart shows total active flows across all routers in your network to be between 150K and 400K. This represents the size of the active flow cache in 1-minute resolution.

Flushed to database
In the default mode, Trisul stores ALL flows to database. A full flow log is invaluable for investigative analysis. This can however be tweaked to suit very high environments such as ISP by setting a threshold value Flow Cutoff Bytes. This allows you to only store flows transferring more than 10MegaBytes .
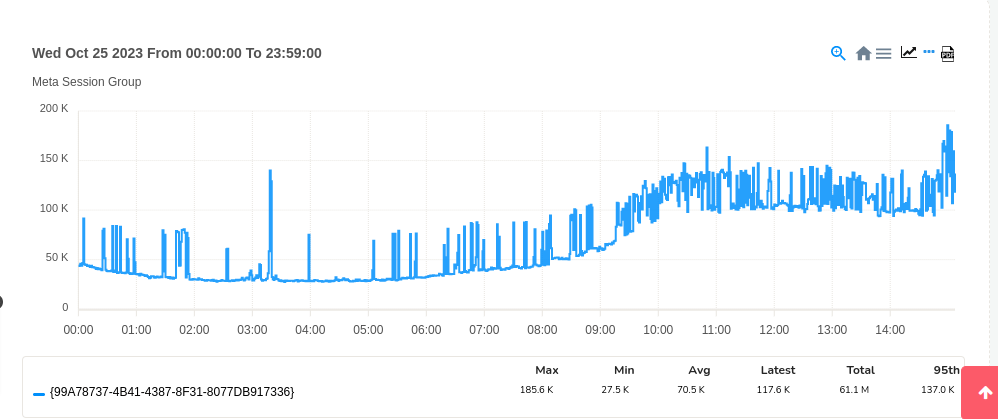
The metric Flushed measures the number of flows saved to the database per minute. The metric can be accessed by Tools > Long Term charts with the following attributes
- Counter Group : Meta Session Group
- Meter : Flushed
- Key : Sessions
The chart shown below shows the Trisul system at this customer flushing 50,000 to 100,000 flows per minute to the database. The total number of flows flushed in the selected time period is shown in the table as 61.1 Million.

You can also view active flows per host and per application. This is available in the Hosts counter group and the App counter group.
Get the full power of Trisul Network Analytics by downloading today.