5.8. Interesting dashboards
This page contains some interesting dashboards that can help you with analytics, and planning.
5.8.1 Key Space Explorer
Imagine you are monitoring a subnet and would like to know the occupancy and usage of an address space. The Key Space Dasboard gives you a magic map chart of which keys are most active on a particular metric in the key space. For example : If your IP Range is 172.16.0.0 to 172.0.1.255 you can enter that and get a chart like the one shown below.
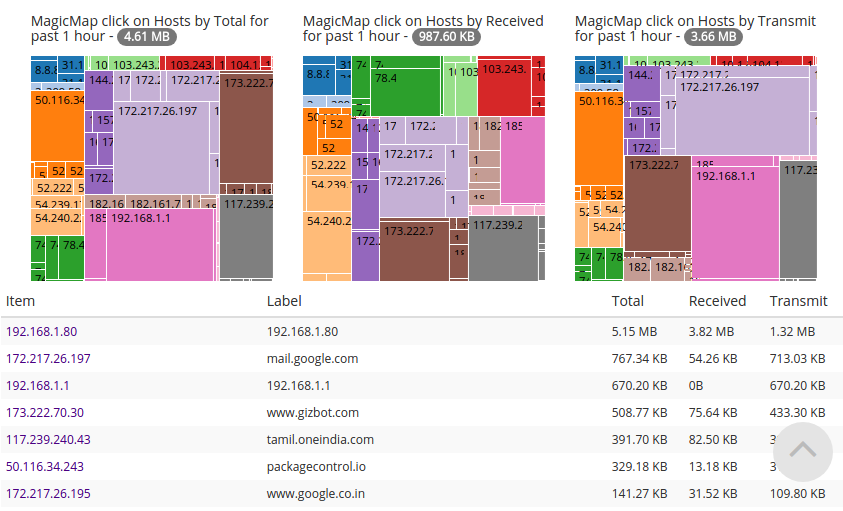
Show usage of keys within a key space
5.8.2 TCP Latency Analysis
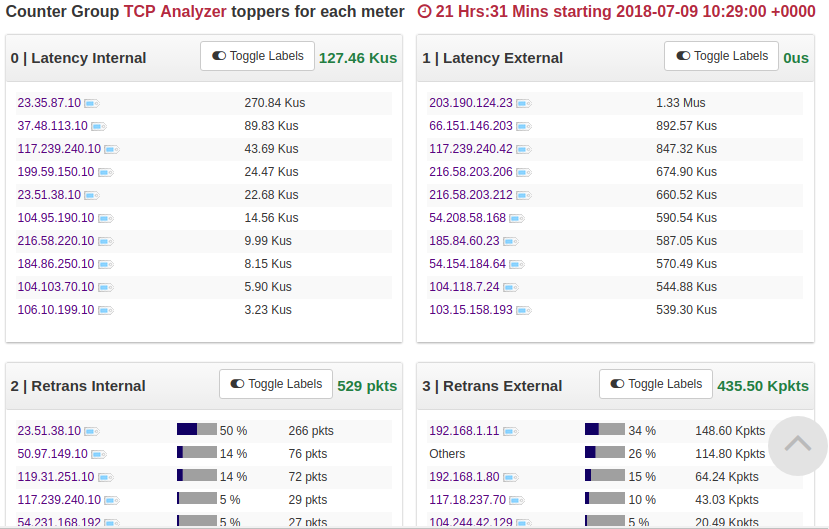
A common problem in network environment is degraded network causing application performance problems. Many of them can be attributed to TCP level issues. This dashboard tracks the following :
- Latency (Round Trip Time)
- monitors latency based on TCP ACKs for both internal and external traffic. Shows the worst performing hosts for each.
- Retransmissions
- retransmission rate for both internal and external.
- Timeouts
- a good indicator of poor network performance is TCP Timeout rate.
Latency and retransmission
The following screenshot sample shows latency in microseconds for both internal and external hosts.
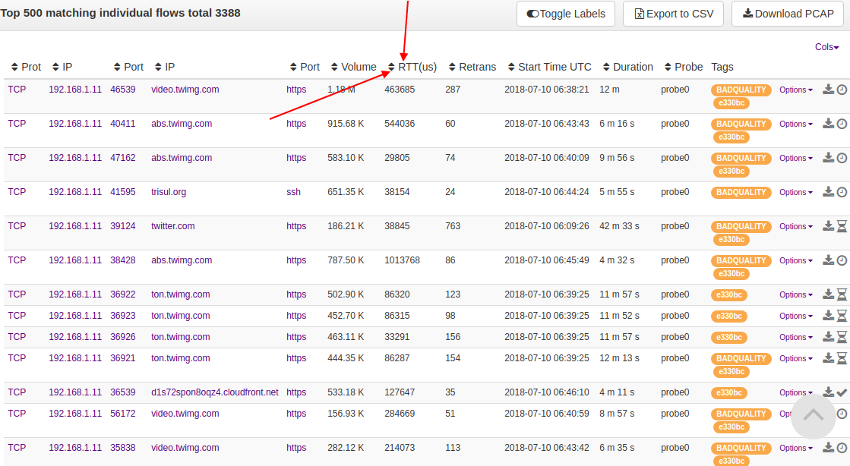
Showing retransmission rate and latency (RTT) for flows
Dashboard showing worst performing flows
Module shows flows having poor (>5%) retransmit rate.
Showing Per-Flow latency
You can drilldown to Per-Flow latency by viewing the RTT and Retrans metrics.
Show per flow latency and retransmission metrics
5.8.3 Monthly summary dashboard
The Monthly summary dashboard is very useful for planning, billing, traffic management, and other activities. It shows totals of any metric on a calendar with per-day metrics.
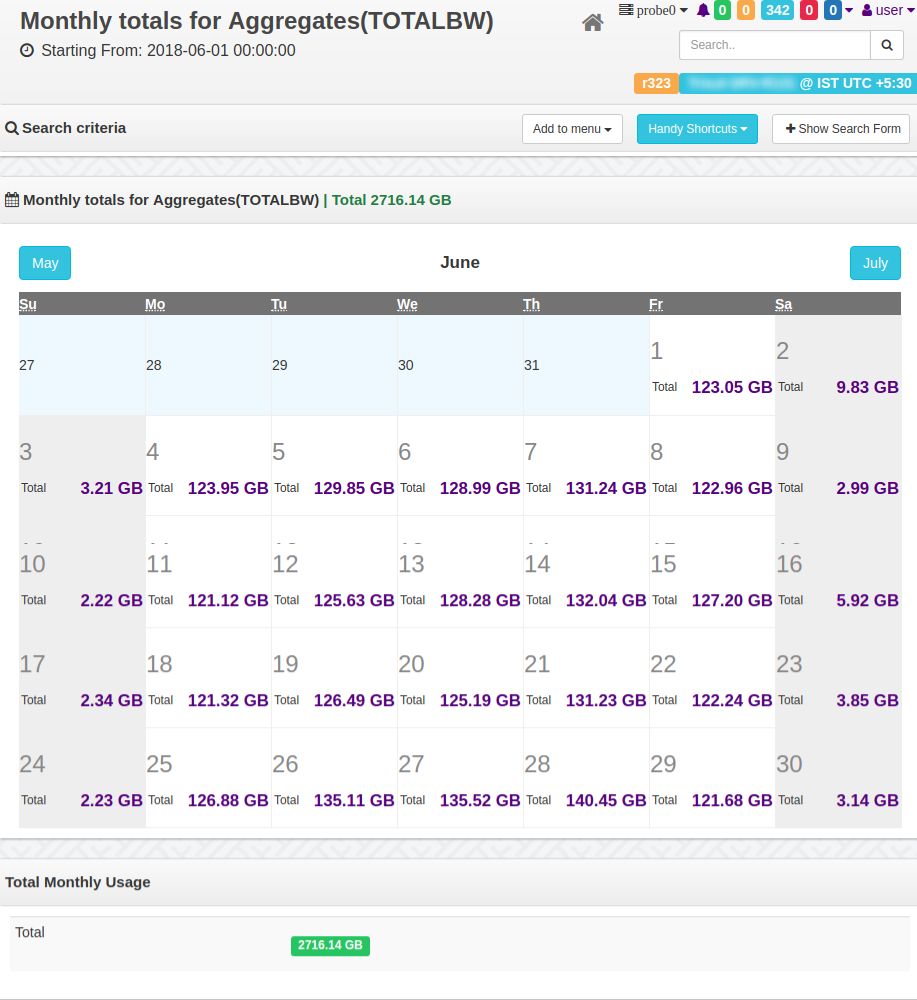
Monthly totals chart showing total bandwidth usage