app:simplebusiness
This is an old revision of the document!
Table of Contents
Simple Business Dashboard
Trisul Network Analytics throws up TONS of metrics. Right out of the box you get about 200+ metrics across 40 counter groups. Sometimes presenting this information can be a challenge. The default install of Trisul puts about 10 dashboards we have selected to put up on the menu.
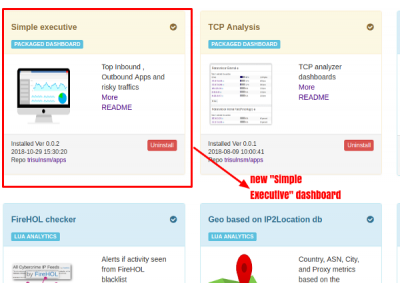
The new Simple Business dashboard gives many customers a different starting point into Trisul, from where you can drill down into other places.
Installing Simple Dashboard
Using Simple Dashboard
Once you install the APP two dashboards are installed.
- A Live Dashboard for showing current data. Accessible from Dashboards > Show All
- A Retro Dashboard for analyzing historic data. Accessible from Retro > Retro Tools > Retro Dashboards
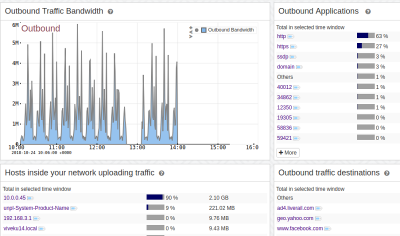
The following data is displayed in the Simple Business dashboard. All items can be drilldown by clicking on the blue button next to the item.
| Outbound traffic breakup | Upload traffic bandwidth, Outbound applications, Top Hosts inside your network uploading data, Top hosts outside your network where data is being uploaded |
| Inbound traffic breakup | Download traffic bandwidth, download applications, Top downloading hosts inside your network, Top downloading hosts from outside |
| Totals | Total traffic, apps, top internal and external hosts |
| Applications | Internet applications breakup based on “Base domains” feature. Shows you how much YouTube, Facebook, Twitter, Netflix, and others independent of IPs |
| Top Risks | Top major alerts seen recently |
You can remove or add any other modules you want to this dashboard !!
app/simplebusiness.1540903269.txt.gz · Last modified: 2018/10/30 18:11 by veera


