
Table of Contents
Analyzing the WRCCDC PCAPs : Part 3 Analysis using TrisulNSM
In this article we will just show pictures and a video of how you might analyze the imported PCAP dumps using Trisul.
This is Part-3 of a 3 Part series
- Part 3: Screenshots & video of analysis paths (using TrisulNSM)
Time to show and tell.
Video showing UI navigations
Trisul has a ton of features and it can be a bit daunting at first where to start, where to go next and so fortm. A sample video made by one of our engineers showing the various places where you can start and gives you a feel for the capabilities. There is a music soundtrack but no narration
Monitoring Techniques
Here are a few screenshots of the dataset showing the monitoring and baseline building techniques described in Part-1 of this series
Start from PCAP Summary Dashboard
Open with Dashboards > Show All > scroll down to the bottom and locate PCAP Summary
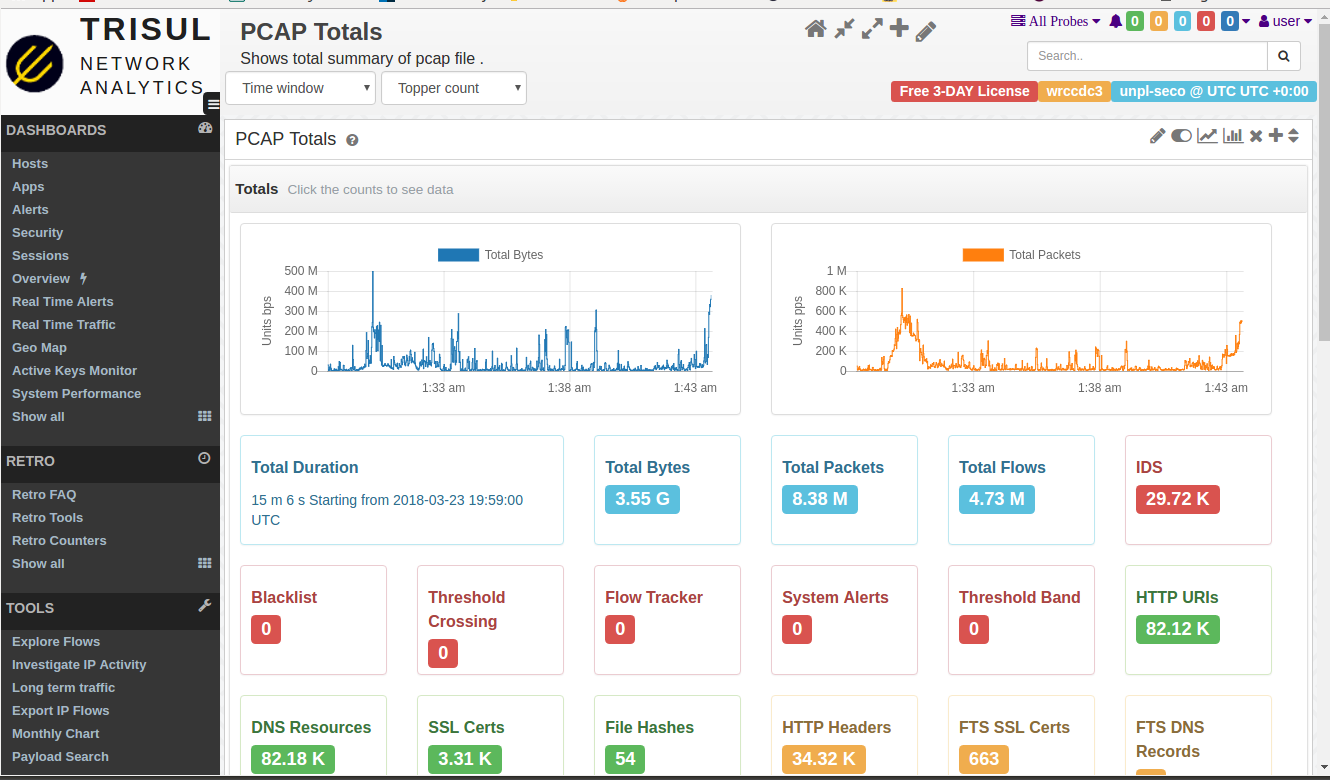
The best place to start is the PCAP summary. Wireshark users can think of it as a supercharged capinfos. It shows you bandwidth usage chart in bytes, packets, total time, number of flows, number of various types of metadata extracted, alerts, etc. You can click on any item to follow an analysis path from there.
Hosts Dashboard
Open with Dashboards > Hosts
The Hosts dashboard is a good top level dashboard to give you a baseline view of host activity. See which internal and external are most active. By volume, by connections, etc. You can click the small button next to each item to drilldown from that. But right now we're just baseline building. You can check out the Apps dashboard for a similar view of Application activity.

Get an overview of flow activity
Open with Dashboards > Sessions
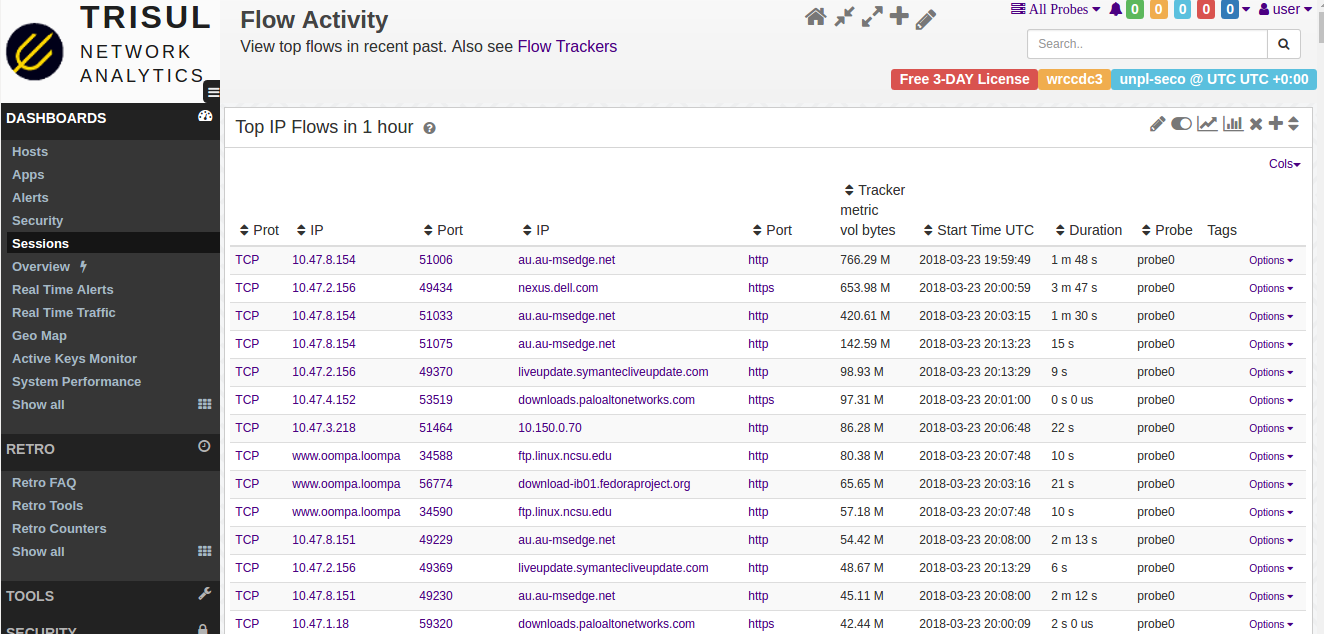
This is a favorite starting point. You can see the PCAP dump from a flow perspective, you immediately get insight into what actual traffic is flowing. In this case , you can immediately see more than 30% of the traffic in the PCAP is from 10-15 flows. There is a lot of windowsupdate, symantec updates, etc. That is useful baseline information to have. You can also get flows uploading data OUT of your network, downloads, long running flows but low volume, etc.
Viewing IDS Alerts
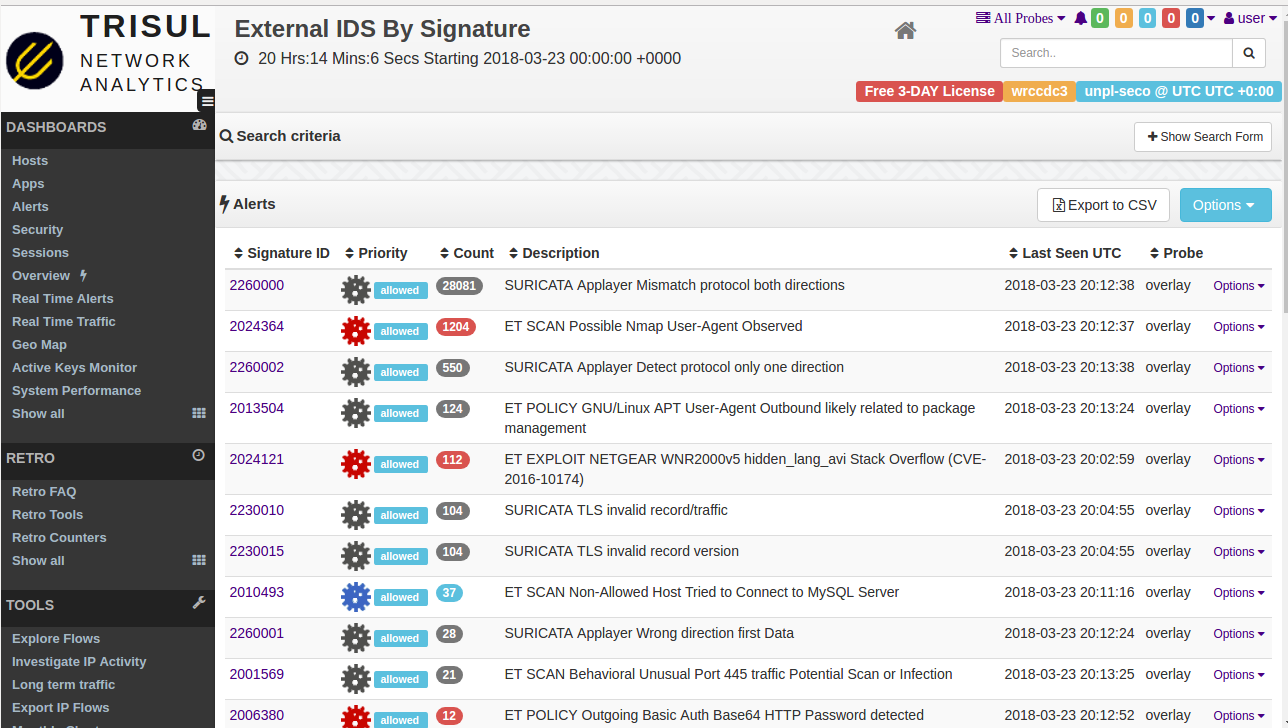
Another great baseline place to start. Remember from Part-1 in addition to Trisul , we also run Suricata with ALL rules from ET-Open ruleset. The alerts generated by this give us a fairly good idea of the hygiene of the network. In this case, as you would expect there are a ton of NMAP scans, a few ETERNALBLUE and other alerts. You can use the “Search” form on the top to filter further. But right now, we have a fairly good baseline from this angle.
Retro Analysis - view advanced counters
To open : Retro > Retro Counters
The retro analysis tools let you select arbitrary timeframe in the past and then drilldown into that. Since TrisulNSM is a streaming analytics tool, it can handle very large timeframes easily compared to search based tools. Here we want to use Retro Counters to view whats in the PCAP dump from a metrics perspective. It only takes seconds per counter and in less than a minute you can get a fantastic baseline from many angles.
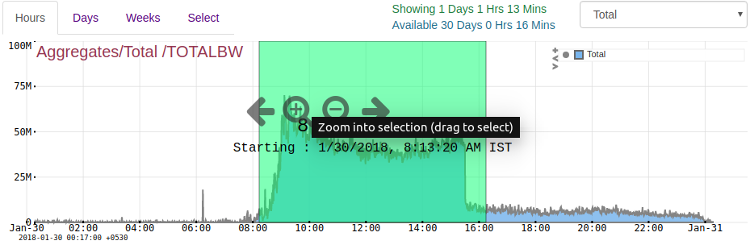
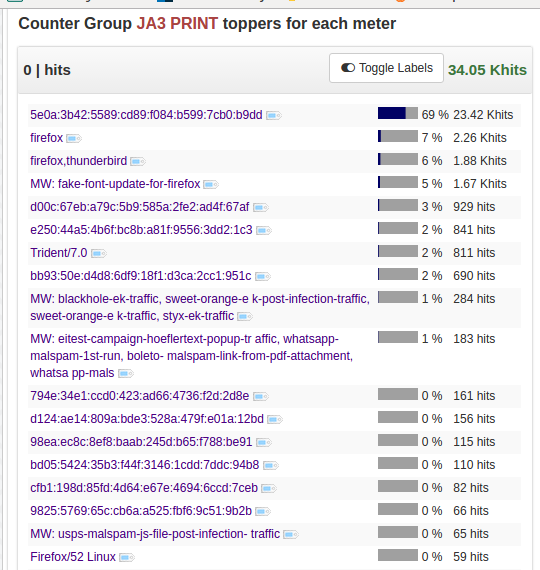
You have to select a time frame from the bandwidth chart and then select one of the 40+ “counter groups” we have built into Trisul. There are groups for TLS counts (Cert authorities, Orgs, ciphers used), SNI, HTTP Hosts, Error codes, Countries, ASN, and several advanced ones like JA3 Hashes. To get the JA3 Hash metrics we have selected a timeframe and the JA3 Print from the drop down list.
Drilldown techniques
Once you have a fairly solid baseline you can go back and decide which paths you want to follow to drilldown further. You might be interested in first checking out the critical IDS alerts, or tracking down flows. This section introduces you to the tools you will use for the drilldowns.
Explore flows
Most of the times you want to first drop down to the flow level. This can be accessed by “Explore Flows” or by clicking on the menu items within the context of whatever you are doing. Most of the screens such as alerts, metrics, etc have a “Explore Flows” option. TrisulNSM stores all flows and reports with blazing speed, even when there are hundreds of millions of them.

Trisul EDGE: Graph analytics discover relationships
We recently added Graph Analytics to Trisul. This solves a common question that analysts ask from any “key” - “what is related to this”. For example you can be looking at the country metrics for Kenya and ask “What are the hosts, apps, external hosts, TLS” connected to this country. In search based solutions, this is typically by enriching the logs (an expensive operation). ALL metrics in Trisul are enabled with this feature. This is right now our preferred place to start drilldowns.

File Extraction
Trisul has the ability using the “Save Binaries” LUA Plugin to extract potentially malicious binaries of any size. This is also a good place to look and see if it is worth drilling down. Here we found 47 such files. Many of them were *.CAB from windows update, but we found 10 EXE files as well.
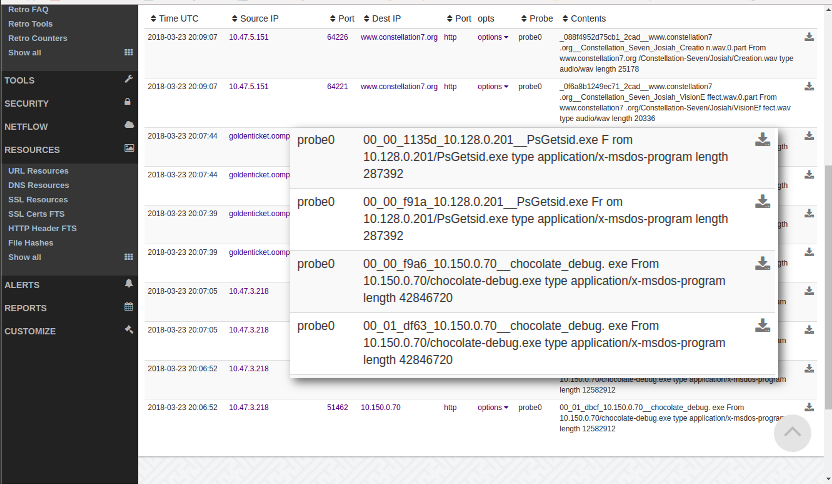
The extracted files are stored by the app in /tmp/savedfiles. We use the actual filename as part of the extracted content, so you can track it easily. If you want to explore further, you can submit it to VirusTotal or YARA.
DOCKER:unpl:root savedfiles$ ls /tmp/savedfiles/*.exe -l
-rw-r--r-- 1 trisul trisul   287392 May 11 12:52 /tmp/savedfiles/00_00_f91a_10.128.0.201__PsGetsid.exe
-rw-r--r-- 1 trisul trisul   287392 May 11 12:52 /tmp/savedfiles/00_00_fb80_10.128.0.201__PsGetsid.exe
-rw-r--r-- 1 trisul trisul 12582912 May 11 12:52 /tmp/savedfiles/00_01_dbcf_10.150.0.70__chocolate_debug.exe
-rw-r--r-- 1 trisul trisul 42846720 May 11 12:52 /tmp/savedfiles/00_01_df63_10.150.0.70__chocolate_debug.exe
DOCKER:unpl:root savedfiles$
Drilldown to Packets
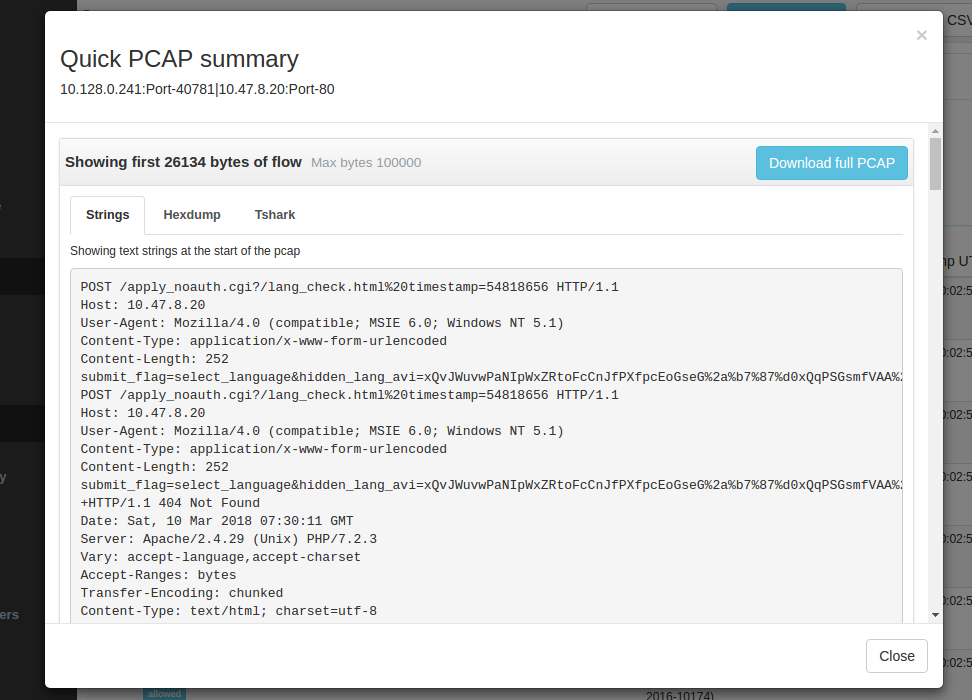
This is the endzone of most drilldowns and hunts. The absolute truth! TrisulNSM can jump to packets from a number of places. We suggest you use the “Quick Packet Headers” option to eyeball the PCAP before bringing it into Wireshark. The Packet Headers has
- Quickly gets the first 100K of the PCAP
- Shows the strings in the PCAP in the 1st pane. This is a very very useful trick, helped us improve speed 10x in many cases.
- In second pane, shows the hexdump in a canonical format
- In the third pane, shows each packet in TSHARK format
- You then decide if you want to download the PCAP into wireshark.
Conclusion
Thank you so much for reading all the way to the end. We hope you find this free TrisulNSM Docker tool useful for monitoring PCAPs as well as for Live networks. The default Free Community License allows you to do a lot on frugal hardware. Check out our site Trisul Network Analytics for more options
We also want to thank the great team at WRCCDC for releasing them. We work with PCAP all the time and know what a tremendous effort it is to assemble them.
Over 1 TB of #PCAP files from the @wrccdc #CDX have been released online thanks to @spiceywasabi and @disturbedmime. The WRCCDC dataset is now linked from our PCAP repository list.