This is an old revision of the document!
Table of Contents
Using Palo Alto User-ID and App-ID in Netflow analytics
Palo Alto firewalls are capable of exporting two very useful pieces for information in its Netflow export. The User-ID1) and App-ID 2) fields are added per-flow
- User-ID : harvested from a number of mechanisms to map IP-Addresses to user names. The primary method is to interface with Microsoft Exchange / AD servers.
- App-ID : the firewall deploys some heuristics to identify exact traffic types (eg Facebook, Google, Whatsapp)
These two fields really turbo charge your visibility and investigation capabilities. This article explains how to leverage these in Trisul Network Analytics.
- monitoring overall traffic of Users and Apps
- searching individual flows for a particular User or App at flow level
- aggregate statistics of a particular User or App.
Monitor overall traffic
New Counter Groups : User-ID and App-ID
Trisul automatically creates two counter groups called User-ID and App-ID. These meter the following metrics at the global level.
| meter | description |
|---|---|
| Total traffic | Total traffic bandwidth used by a User or App |
| Download traffic | Download bandwidth used by per User/App. The Download direction is metered when the flow source IP is an external IP address and the destination-IP is internal. Internal IPs belong to the Home Network configured in Trisul |
| Upload traffic | per-User bandwidth out of home network to external |
| Internal traffic | per-User bandwidth where both the source and destination are inside the home network |
| Transit traffic | where both source and destination are outside the home network. You will typically not find data here in normal enterprise environments |
| Flows | Total number of flows active per user/app |
To view these metrics
- Use Retro Analysis : Select Retro > Retro Counters then select a time frame, then select User-ID from the list of counters shown on the right side. You can see the top items for each metric.
- Create dashboards : Customize > UI >Dashboards > Create a new dashboard. Give it a name. Then Press the + button to add a new module. Clone “Current Top Hosts” of type “current toppers in a list”. Then edit to module to change to User-ID and Metric 0.
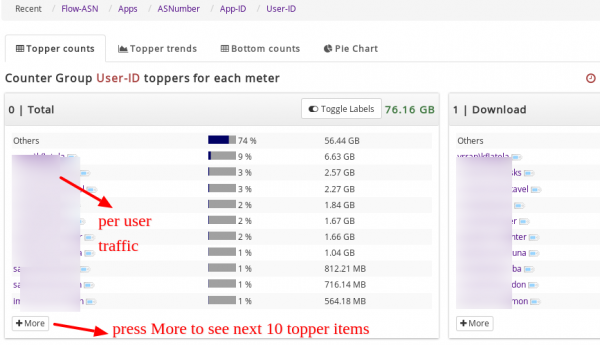
The retro analysis screen looks like below.
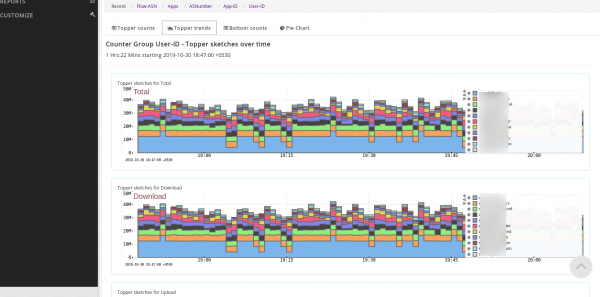
The Retro Analysis tools show you the Top-N, Bottom-N, Topper Trend over time, and Pie chart views. The following chart shows you toppers over time.
NAT issues
Create flow tags
Query by user-id and app-id
Aggregate flows
Crosskeys


